
Every week during the season, dozens of them drop. Thirty-two teams, ranked one through thirty-two, reshuffled every Tuesday based on who won Sunday. The Bills beat the Chiefs, so the Bills jump four spots. The Chiefs lost, so they slide. Next week it reverses, and everyone nods along like something was learned.
Nothing was learned. A power ranking is mostly a record of what already happened, dressed up as insight. It has no memory of what it said last month and no accountability for what it says today. It cannot tell you whether a 10-win team is built to stay there or about to fall off a cliff — because it was never trying to answer that question in the first place.
That’s the question worth answering. And it’s the one nobody was answering.
What we actually built
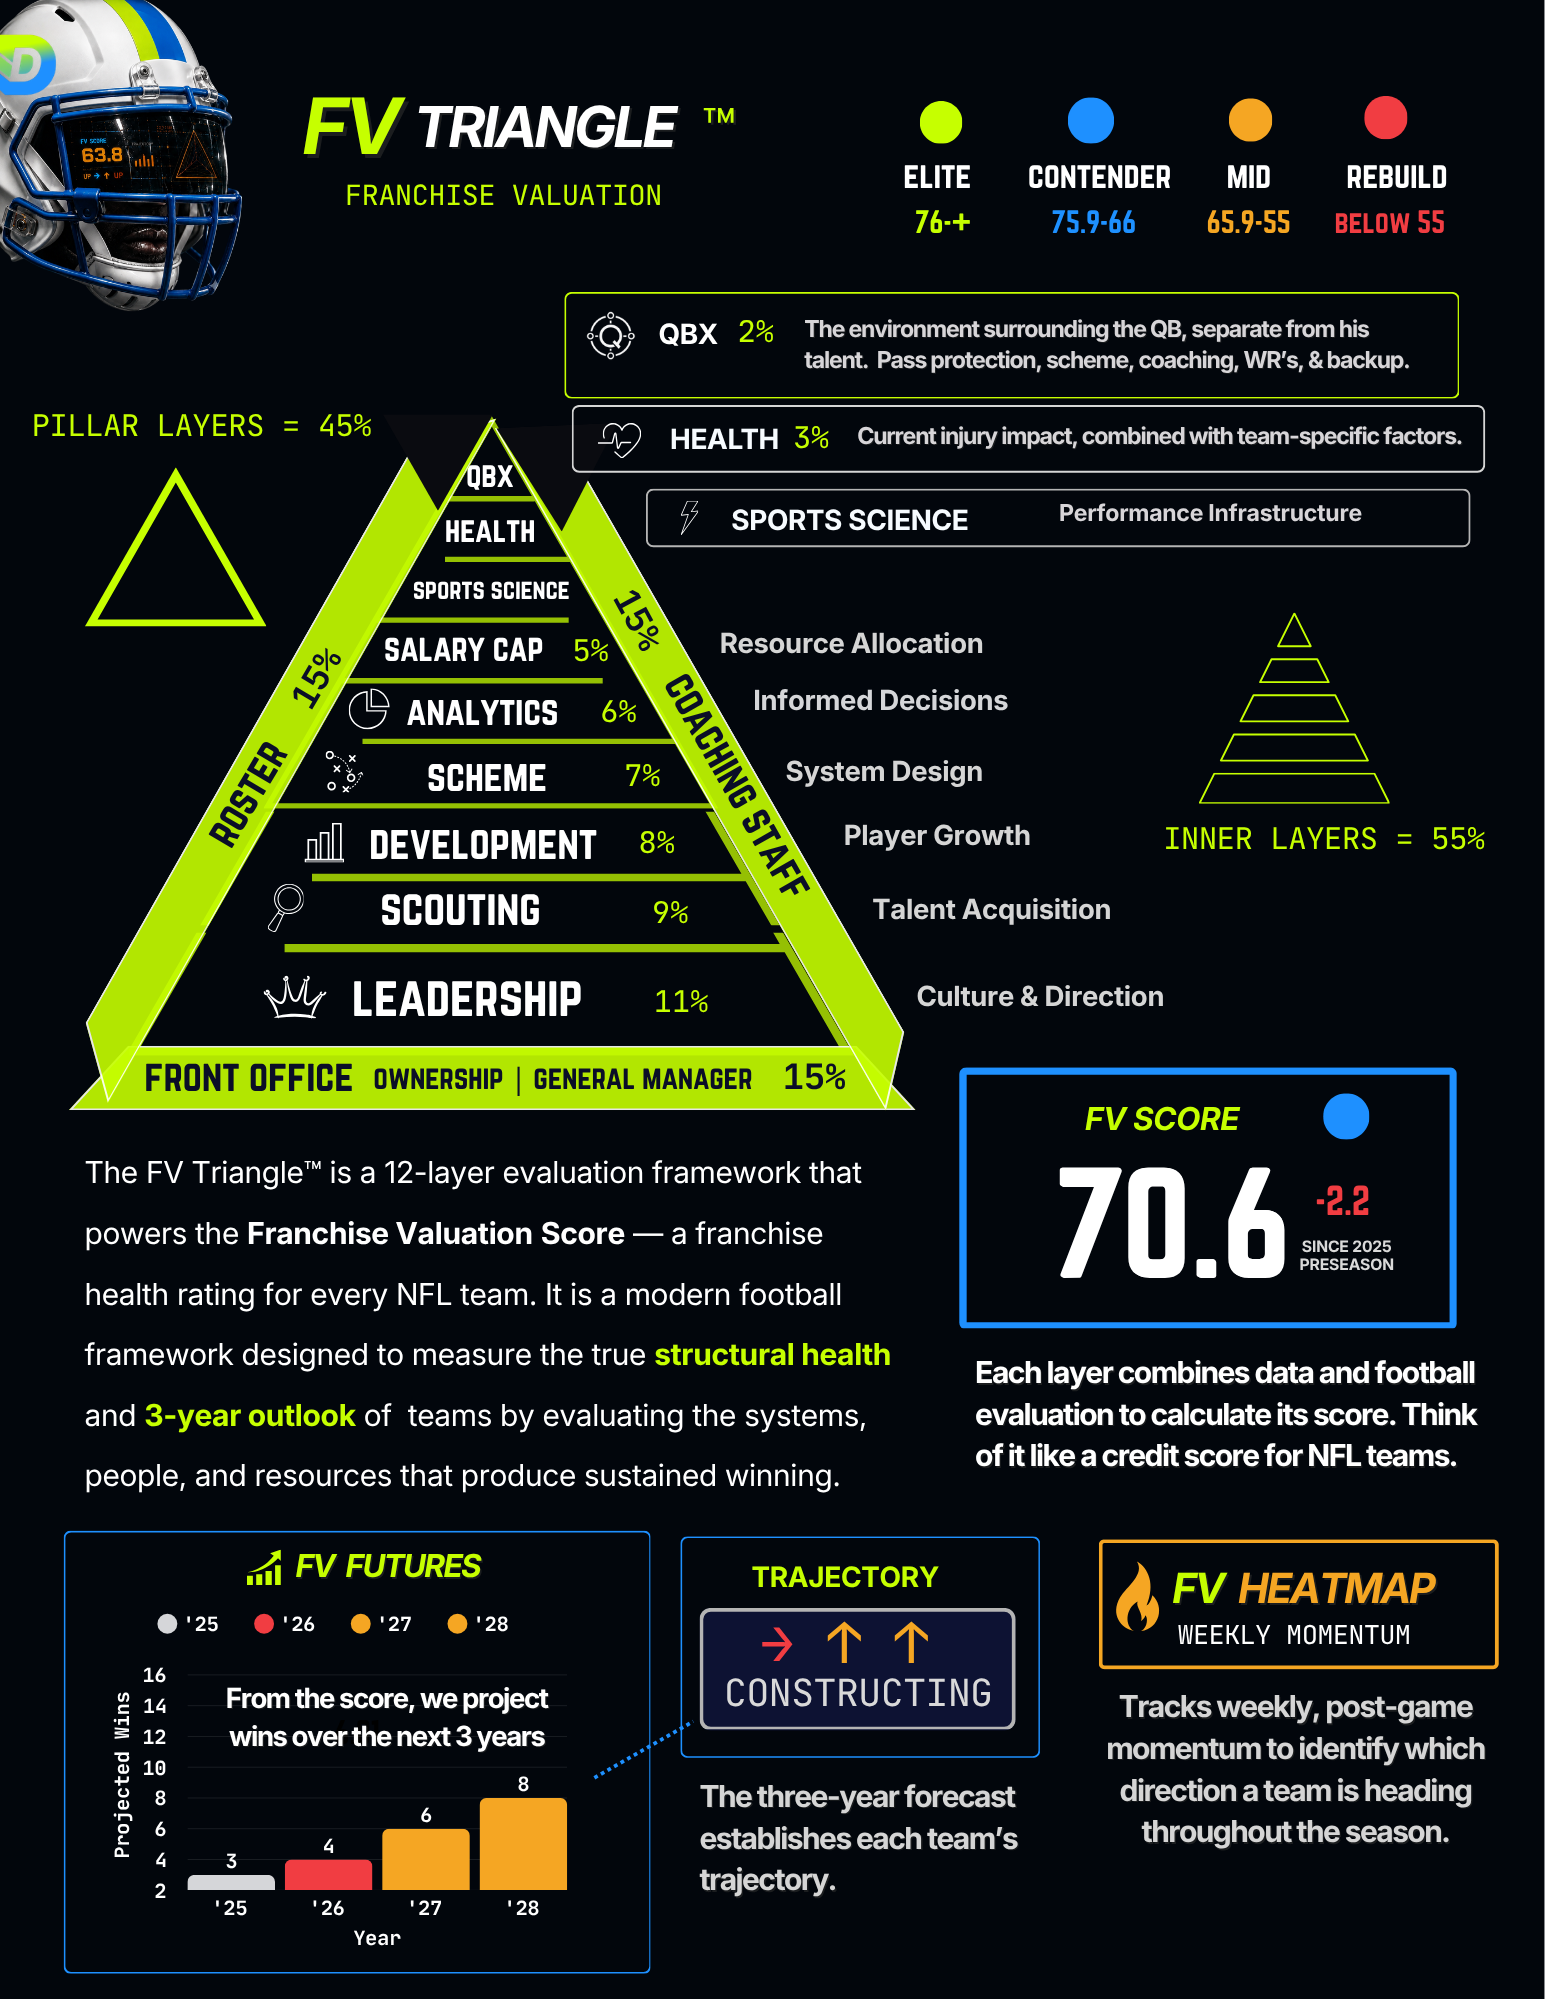
The FV Triangle is a franchise valuation system. Think of it like a credit score for NFL teams — a single number, out of 100, that measures how structurally healthy an organization is and where it’s headed over the next three seasons.
Not how good the team looked last Sunday. How well it’s built.
A credit score doesn’t care that you had a good day. It looks at the underlying structure — the income, the debt, the history, the trajectory — and tells you whether you’re set up to succeed or quietly heading for trouble. The FV Triangle does the same thing for a football franchise. It looks past the scoreboard at the machinery that produces the scoreboard.
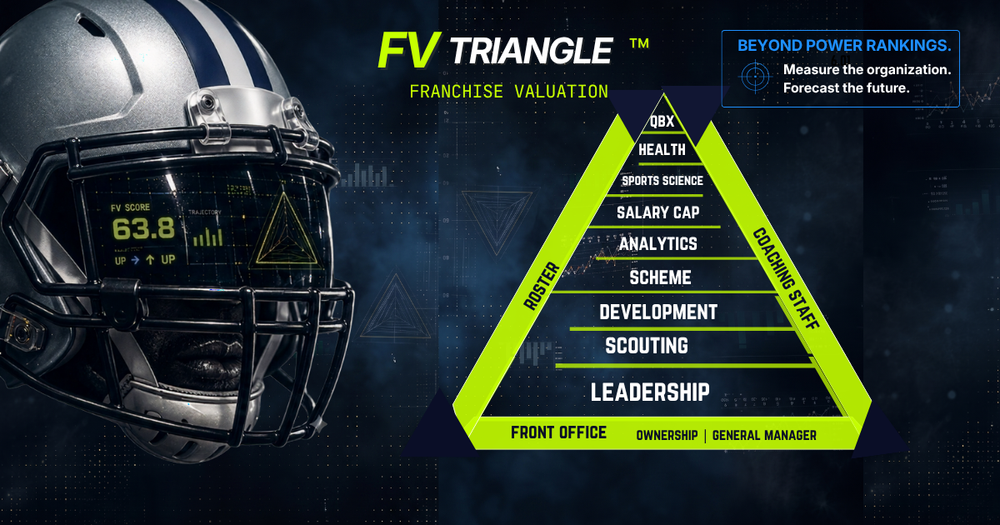
That machinery is twelve layers. Three outer pillars — Roster, Coaching Staff, and Front Office — surround nine internal layers, from Leadership at the foundation through Talent Evaluation, Development, Scheme, Analytics, Salary Cap, Sports Science, Health, and QBX at the apex. Each layer is scored, weighted by how much it actually contributes to sustained winning, and rolled into one number.
The foundation carries the most weight, because it should. Leadership and talent evaluation matter more over three years than this week’s injury report. A power ranking can’t tell you that. It’s too busy reacting to this week’s injury report.
The lie you’ve been told
For years, we've been told the numbers were enough. Feed enough data into the model, the thinking goes, and the truth falls out the other end. Trust the process. Trust the numbers.
But numbers don’t build themselves. They’re produced by people: the coaches who design the scheme, the front offices that allocate the cap, the scouts who find the talent, the culture that decides whether any of it holds together under pressure. A completion percentage is an output. The question is what produced it, and whether that thing is stable.
We don’t ignore the stats. We have an entire layer for analytics — and one of the highest-scoring departments in our first year turned out to be one an MIT-trained front office was quietly building in Cleveland, months before the national reporting caught up to it at the Draft. We love the numbers. We just refuse to pretend they exist in a vacuum. Read the people, and the stats they produce will begin to make sense.
We keep the receipts
Here’s the part that makes this different from every ranking you’ve ever read: we write it down, we freeze it, and we let reality grade us.
Every preseason, we publish a three-year forecast for all 32 teams. Then we lock it. It becomes a vintage — a permanent, dated record of exactly what we believed and when. We can’t quietly edit it after the fact. When we’re right, the record shows it. When we’re wrong, the record shows that too.
In our first year, the teams our model ranked highest won, on average, about three more games than the teams we ranked lowest — in one of the most chaotic seasons in recent memory. We had real calls the market missed: we were low on some teams everyone believed in, and high on some nobody did, and we were right on both sides.
We also missed. Some of our win projections ran hot. We’re not going to hide that, because the entire point of a frozen forecast is that you can check it. A system that only shows you its hits isn’t an accountability system. It’s marketing.
That’s the trade we’re offering. Not the confidence of a number that reshuffles every week and never has to answer for itself — but a call, made in advance, that you get to hold us to.
This isn’t a ranking. It’s a scorecard for the front office.
The NFL doesn’t need another list of who looked good last weekend. It has plenty of those. What it’s missing is a way to think about franchises the way the people who run them do — structurally, three years out, with the discipline to be graded on it.
That’s what we built. A framework for the fan who doesn’t just want to know who’s winning, but why, and whether it lasts.
The FV Triangle scores all 32 NFL franchises across 12 structural layers, with weekly momentum, quarterly valuations, and annual three-year forecasts.
Start with your team.
Grab your free FV Snapshot at Draft Stacks and see where your franchise scores as they are unveiled the week of August 10th.