12 Layer Framework
The NFL is more than wins and losses.
Beyond Power Rankings.
Measure the organization. Forecast the future.
“What is Franchise Valuation?”
A team’s record tells you what happened.
FV asks what’s coming next.
A team can have:
- a great roster and poor leadership
- an elite quarterback and weak development infrastructure
- strong coaching and poor resource allocation
- excellent talent evaluation but declining organizational health
The FV Triangle attempts to measure those underlying conditions.
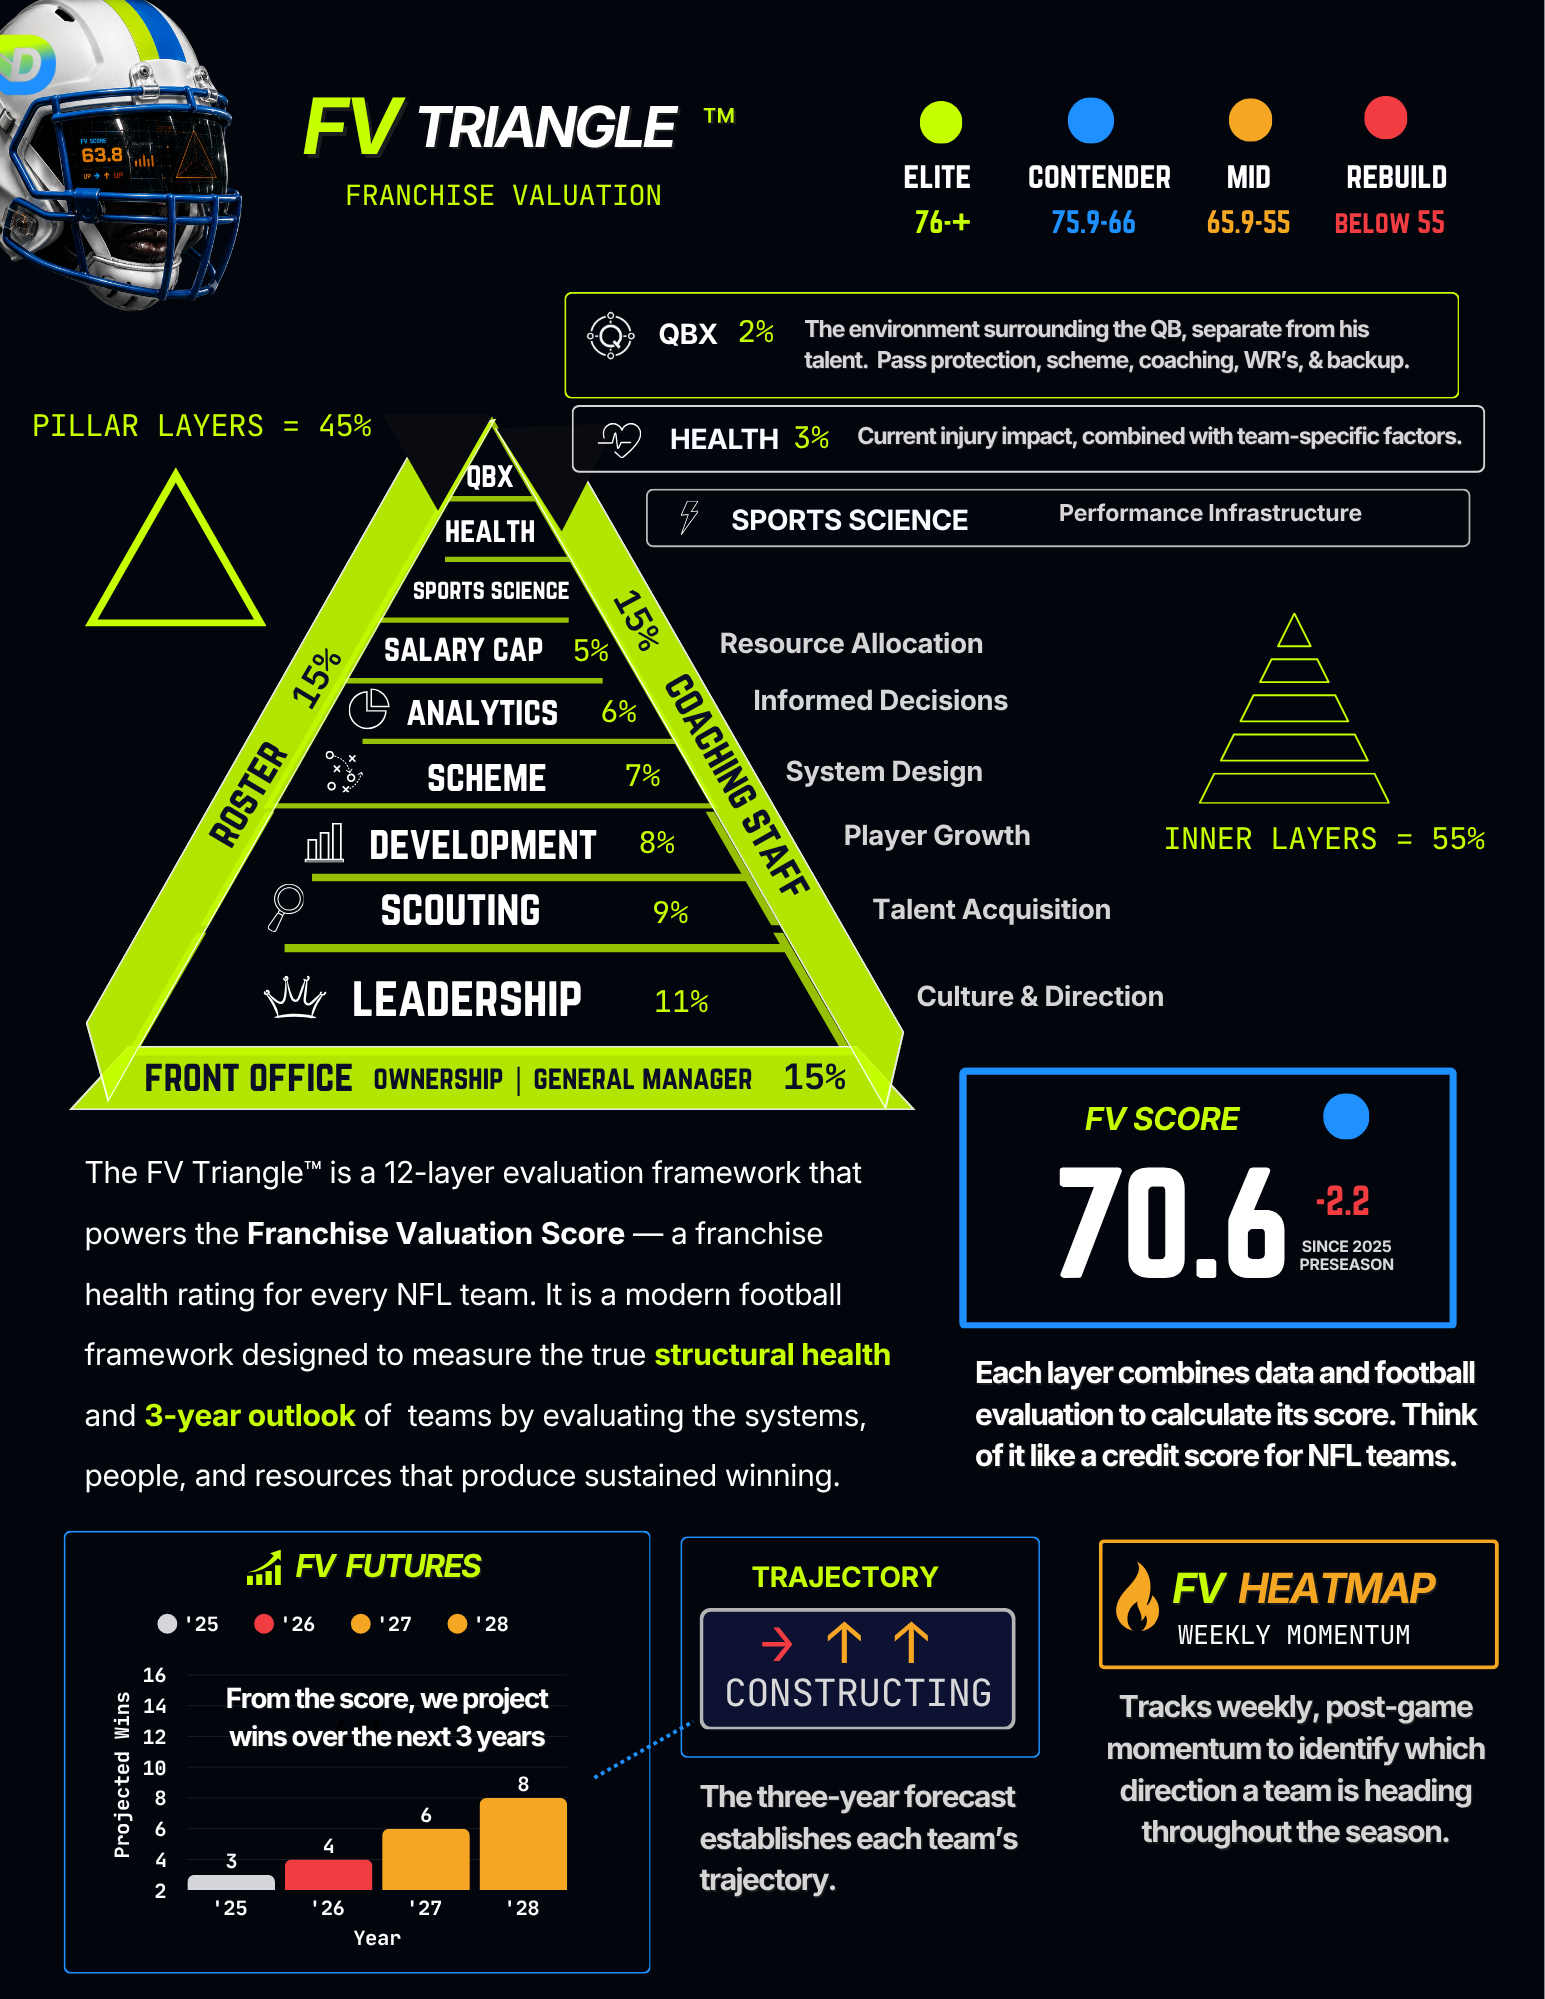
The 12 Layers
Roster (15%)
The talent under contract right now. Captures quarterback quality, position-group strength across the depth chart, and the trajectory of assets acquired through recent drafts and free agency.
Coaching Staff (15%)
The people running the football operation on the field. Captures head coach quality, coordinator effectiveness, position coach depth, and in-game decision-making — including whether NFL players themselves rate the head coach highly.
Front Office (15%)
The organizational leadership above football operations. Captures general manager quality, ownership stability and football investment, cap management track record, and multi-year draft and personnel decisions.
Leadership (11%)
Organizational alignment across owner, GM, head coach, and locker room. Measures whether the franchise’s leadership pillars work as a cohesive unit or pull in competing directions — the only layer that touches all three pillars and determines whether the other layers can function.
Scouting (9%)
The front office’s ability to identify NFL talent. Measures multi-year draft hit rates, blue-chip talent identification, and success finding contributors in late rounds and undrafted free agency.
Development (8%)
The organizational ability to turn drafted talent into contributors. Measures player improvement trajectories, position coach effectiveness on outcomes, and how successfully rookies convert to second-contract retention.
Scheme (7%)
The effectiveness of offensive and defensive systems on the field. Measures scheme quality in normal and situational football, plus adaptability when opponents adjust — the on-field manifestation of coaching quality.
Analytics (6%)
The organization’s infrastructure for data-informed decision making. Measures department staffing depth, coach-analytics integration, technology investment, and public indicators of analytical sophistication.
Salary Cap (5%)
The financial machinery supporting the roster. Measures current and future cap flexibility, free agency exposure, sunk costs from past contracts, and contract structure discipline (sustainable vs. leveraged).
Sports Science (4%)
The infrastructure that keeps players healthy and maximizes their performance. Measures facility investment, staff quality, recovery infrastructure, and injury prevention track record.
Health (3%)
The current-state injury outlook heading into the season. Measures preseason injury burden, playing surface quality, and roster age at injury-prone positions — factors that shape whether the team’s talent can stay on the field.
QBX (2%)
The environment surrounding the quarterback, separate from his talent. Measures pass protection, QB coach quality, backup QB depth, scheme fit for the starter’s skill set, and pass-catching weapons — the five things that make a quarterback’s job easier or harder independent of his own ability.
Draft Stacks Terminal (Coming Soon)
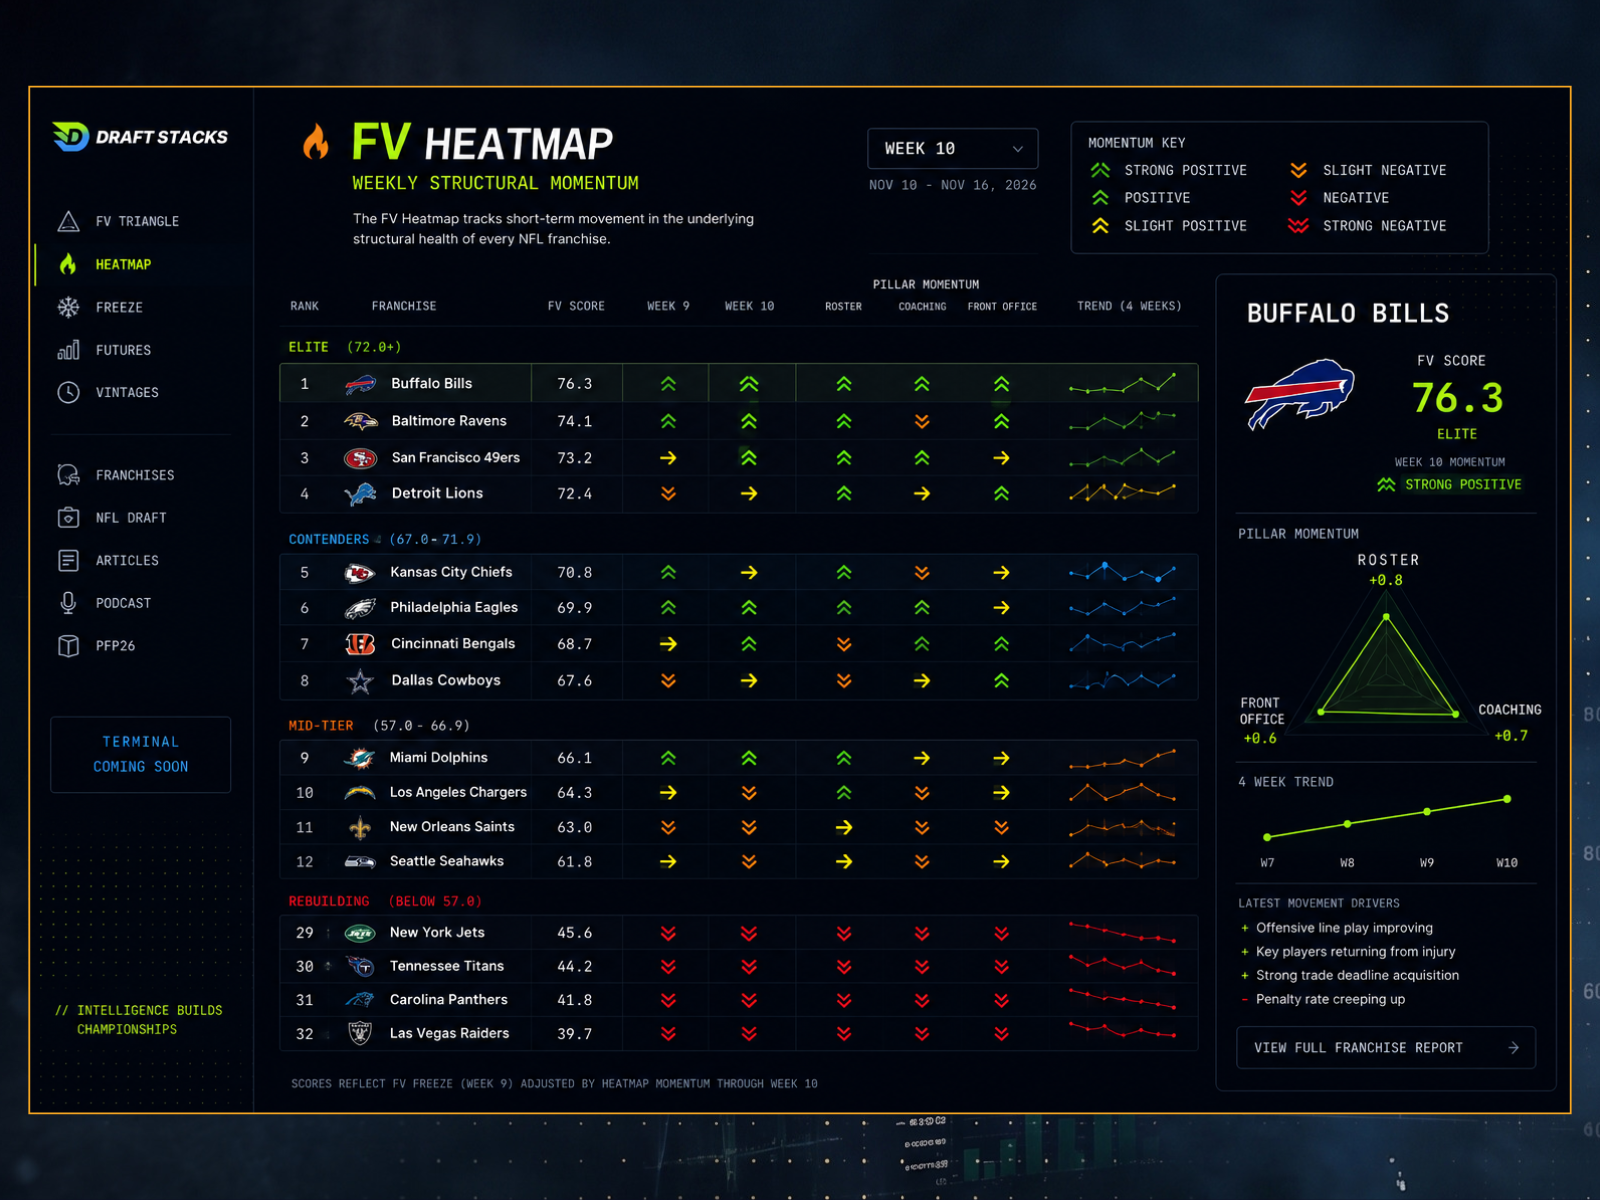
Terminal will be our data visualization hub to display interactive team and player information for subscribers.